Copying and pasting data
Getting data into R can be quite difficult if it doesn’t come in a pre-made format.
I’m talking specifically about data in tables on websites, but this also applies to Excel spreadsheets with odd formatting structures or on PDFs.
Being a disciplined documenter of the process requires that all the steps taken to scrape data from a website or to import data from Excel or a PDF be clearly listed step by step, as well as what it took to transform the data workable dataframe.
Datapasta skips those steps and lets users copy data structured in a table from somewhere else and paste it directly into RStudio.
Sometimes you just want to play around with the data right away.
Datapasta in action
I’m going to show you how to use datapasta but only because I’m assuming you’ll go back and bring the data in correctly later on as you’re adding documentation to your project.
What is tribble()? It’s a new package that lets you build dataframes in a more human-readable way. Check out tibble.
Datapasta depends on keyboard shortcuts and using RStudio. That’s why you’ll see things magically appear in the GIF above without any clear commands. I’ll explain below.
Install and load the packages below
# install.packages("datapasta")
library(datapasta)

# install.packages("tibble")
library(tibble)
Now go to Tools > Addins > Browse Addins…
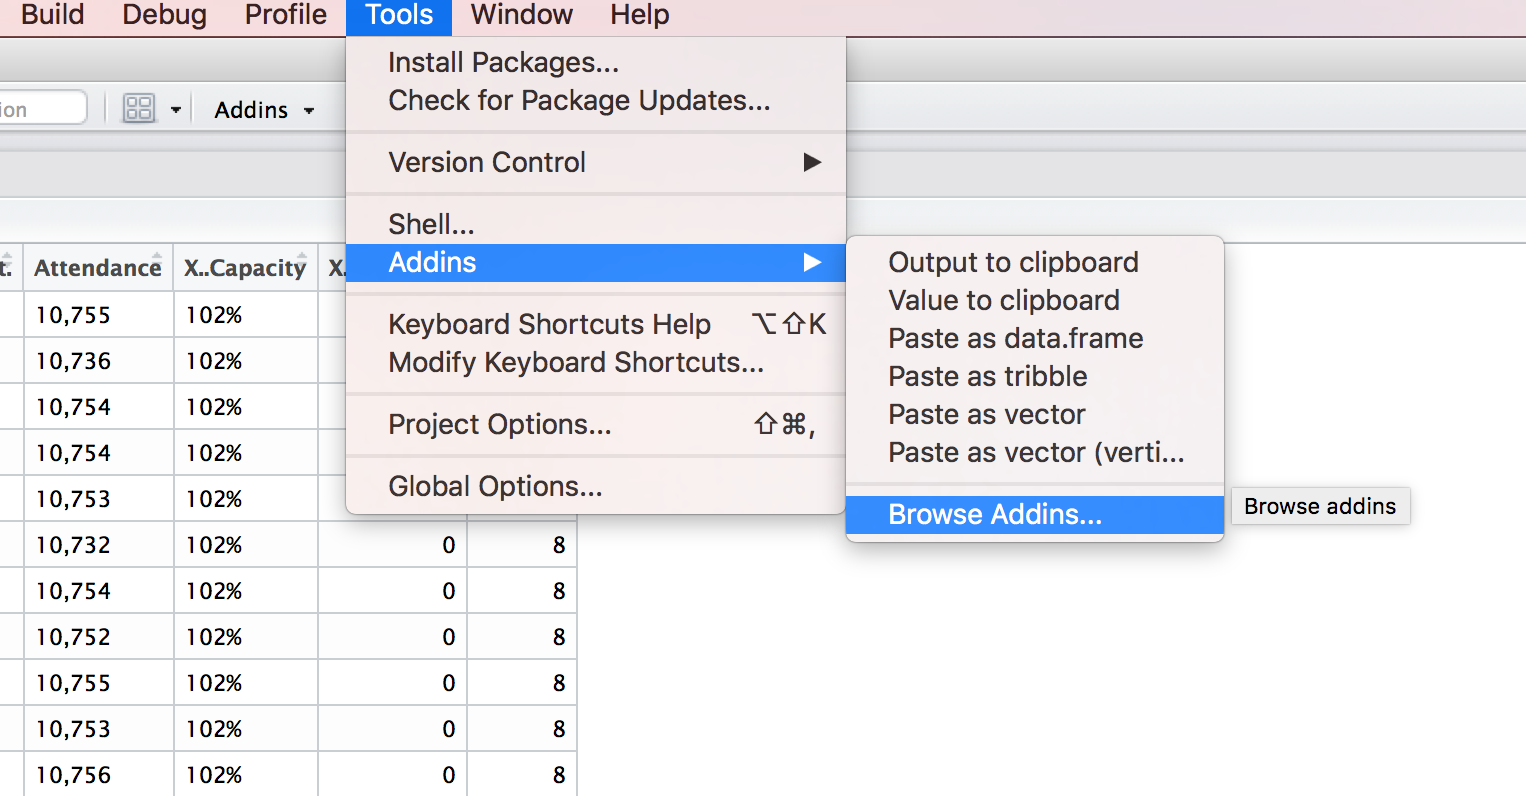
Browse
Next, click the Keyboard Shortcuts button.
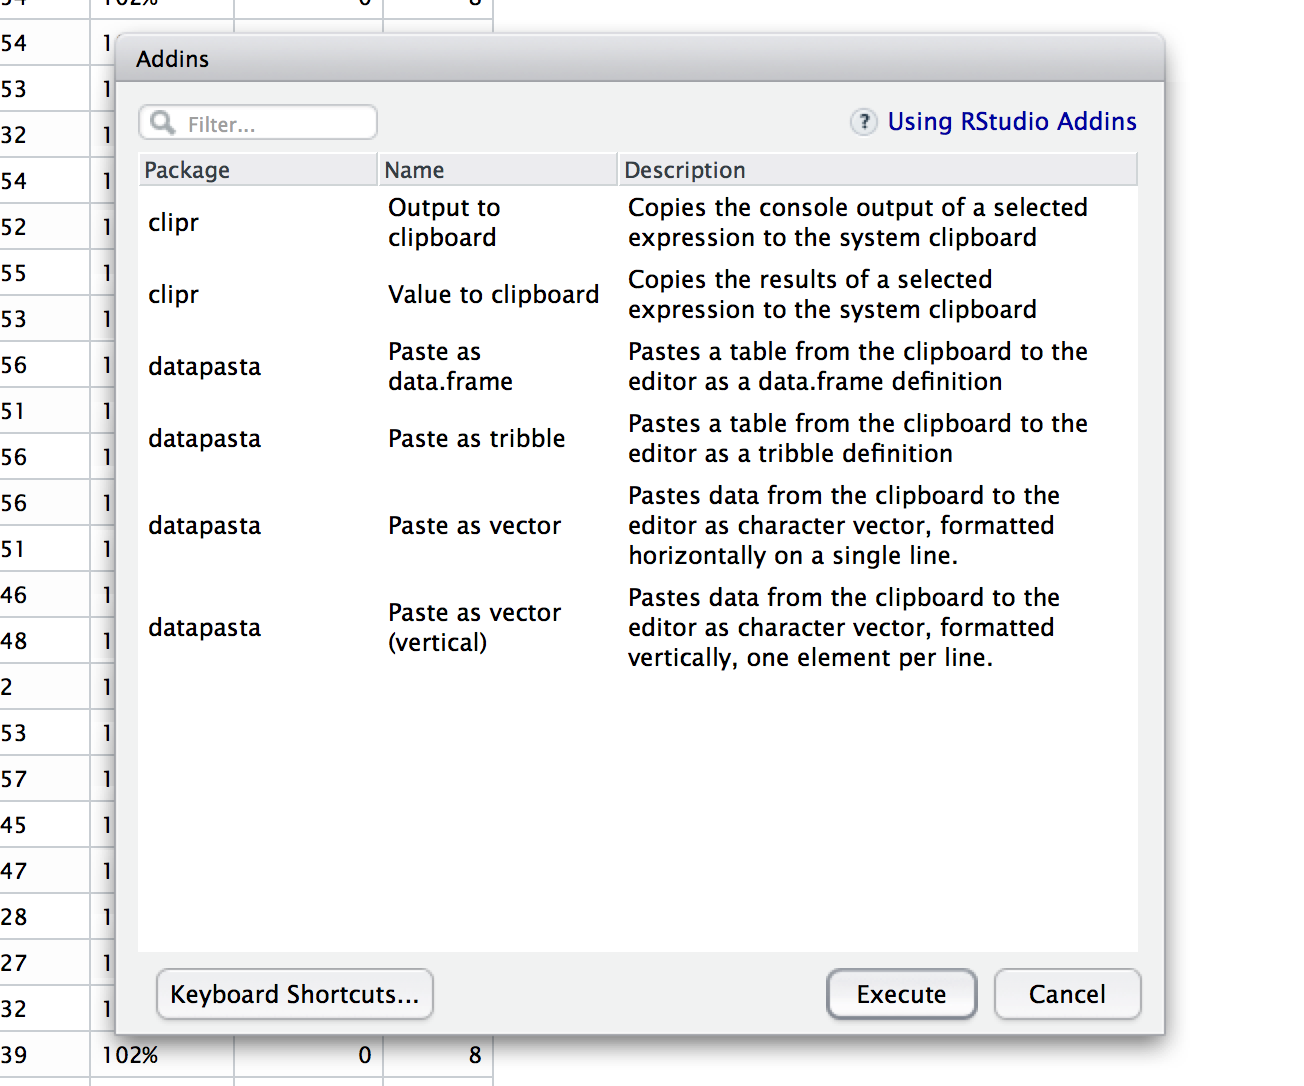
Browse
Now, click add the keyboard shorts for each type of data you’re creating in the Shortcuts column.
Those are the recommended shortcut commands, but create your own custom one if you want.
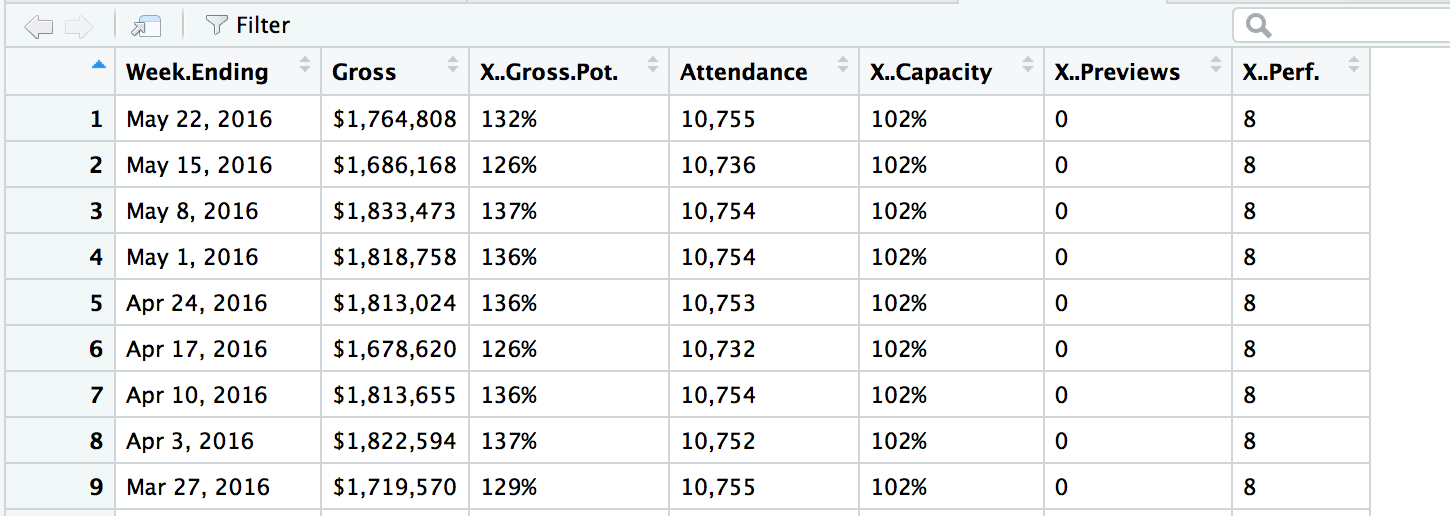
Let’s go to the Internet Broadway Database and look up some Hamilton statistics.
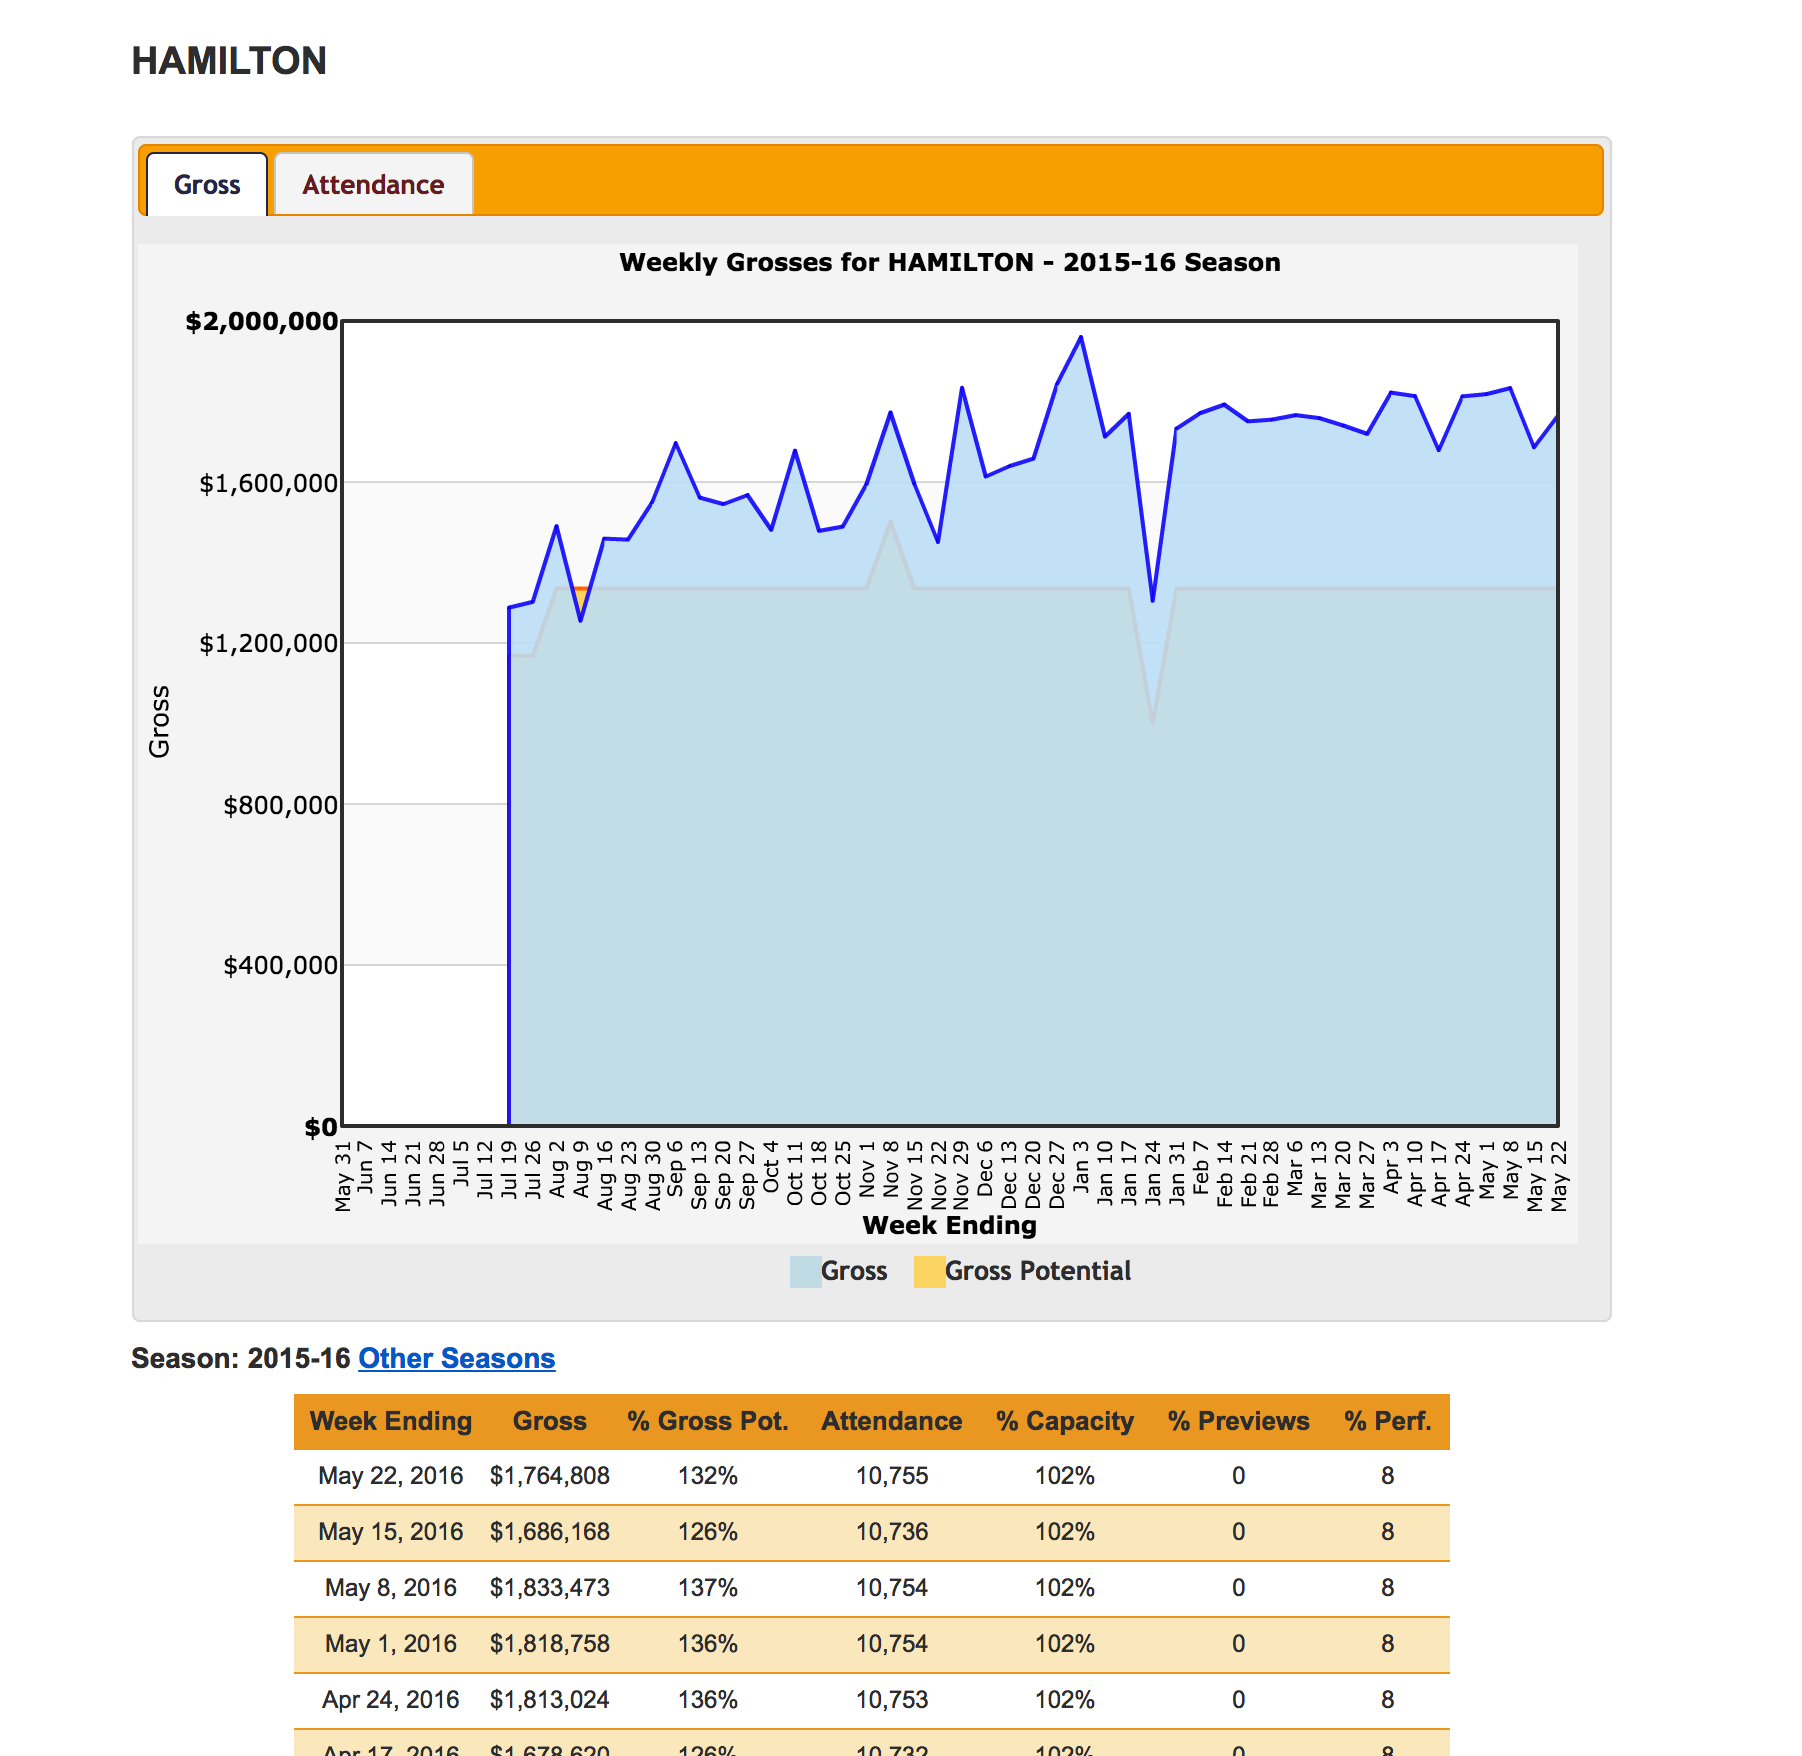
Browse
Select the data in the table and go over to RStudio and use your shortcut to bring in the tibble (for me, it was shift+cmd+T).
You’ll get something like this.
tribble(
    ~Week.Ending,       ~Gross, ~X..Gross.Pot., ~Attendance, ~X..Capacity, ~X..Previews, ~X..Perf.,
  "May 22, 2016", "$1,764,808",         "132%",    "10,755",       "102%",            0,         8,
  "May 15, 2016", "$1,686,168",         "126%",    "10,736",       "102%",            0,         8,
   "May 8, 2016", "$1,833,473",         "137%",    "10,754",       "102%",            0,         8,
   "May 1, 2016", "$1,818,758",         "136%",    "10,754",       "102%",            0,         8,
  "Apr 24, 2016", "$1,813,024",         "136%",    "10,753",       "102%",            0,         8,
  "Apr 17, 2016", "$1,678,620",         "126%",    "10,732",       "102%",            0,         8,
  "Apr 10, 2016", "$1,813,655",         "136%",    "10,754",       "102%",            0,         8,
   "Apr 3, 2016", "$1,822,594",         "137%",    "10,752",       "102%",            0,         8,
  "Mar 27, 2016", "$1,719,570",         "129%",    "10,755",       "102%",            0,         8,
  "Mar 20, 2016", "$1,740,104",         "130%",    "10,753",       "102%",            0,         8,
  "Mar 13, 2016", "$1,758,555",         "132%",    "10,756",       "102%",            0,         8,
   "Mar 6, 2016", "$1,766,223",         "132%",    "10,751",       "102%",            0,         8,
  "Feb 28, 2016", "$1,755,010",         "131%",    "10,756",       "102%",            0,         8,
  "Feb 21, 2016", "$1,750,924",         "131%",    "10,756",       "102%",            0,         8
  )
Don’t forget to assign it to an object
new_table <- tribble(
    ~Week.Ending,       ~Gross, ~X..Gross.Pot., ~Attendance, ~X..Capacity, ~X..Previews, ~X..Perf.,
  "May 22, 2016", "$1,764,808",         "132%",    "10,755",       "102%",            0,         8,
  "May 15, 2016", "$1,686,168",         "126%",    "10,736",       "102%",            0,         8,
   "May 8, 2016", "$1,833,473",         "137%",    "10,754",       "102%",            0,         8,
   "May 1, 2016", "$1,818,758",         "136%",    "10,754",       "102%",            0,         8,
  "Apr 24, 2016", "$1,813,024",         "136%",    "10,753",       "102%",            0,         8,
  "Apr 17, 2016", "$1,678,620",         "126%",    "10,732",       "102%",            0,         8,
  "Apr 10, 2016", "$1,813,655",         "136%",    "10,754",       "102%",            0,         8,
   "Apr 3, 2016", "$1,822,594",         "137%",    "10,752",       "102%",            0,         8,
  "Mar 27, 2016", "$1,719,570",         "129%",    "10,755",       "102%",            0,         8,
  "Mar 20, 2016", "$1,740,104",         "130%",    "10,753",       "102%",            0,         8,
  "Mar 13, 2016", "$1,758,555",         "132%",    "10,756",       "102%",            0,         8,
   "Mar 6, 2016", "$1,766,223",         "132%",    "10,751",       "102%",            0,         8,
  "Feb 28, 2016", "$1,755,010",         "131%",    "10,756",       "102%",            0,         8,
  "Feb 21, 2016", "$1,750,924",         "131%",    "10,756",       "102%",            0,         8
  )
How’s it look?
View(new_table)
Simple!
Now you can now clean up the column names and up by taking out commas, dollar signs, percent signs, etc, so you can do some analysis or visualization of the data. (We’ll get into that later)
Why did we use tibble instead of the shortcut to build a dataframe? Well, the tibble package is more forgiving of bringing in information with odd characters. If you used the shortcut to bring in the data frame via shift+cmd+D, RStudio would’ve given you an error.
Using datapasta with vectors
Sometimes you don’t want a whole dataframe and just want a an array.
Use the shortcut to paste as vector (shift+cmd+V) would turn a single copied row of that Hamilton data into
c("May 22",
  " 2016",
  "$1",
  "764",
  "808",
  "132%",
  "10",
  "755",
  "102%",
  "0",
  "8")
## [1] "May 22" " 2016" "$1" "764" "808" "132%" "10"
## [8] "755" "102%" "0" "8"An alternate way to do it is to paste each element on its own separate line, which is nice if you have an extremely long list of data and don’t want to have to scroll right to find an element. The shortcut I recommend you setting up is shift+cmd+alt+V
c("May 22",
" 2016",
"$1",
"764",
"808",
"132%",
"10",
"755",
"102%",
"0",
"8")## [1] "May 22" " 2016" "$1" "764" "808" "132%" "10"
## [8] "755" "102%" "0" "8"